
Visualizing Pipelines
You can visualize your pipelines as graphs to better understand how the components are connected.
Haystack pipelines have draw() and show() methods that enable you to visualize the pipeline as a graph using Mermaid graphs.
Data Privacy NoticeExercise caution with sensitive data when using pipeline visualization.
This feature is based on Mermaid graphs web service that doesn't have clear terms of data retention or privacy policy.
Prerequisites
To use Mermaid graphs, you must have an internet connection to reach the Mermaid graph renderer at https://mermaid.ink.
Displaying a Graph
Use the pipeline's show() method to display the diagram in Jupyter notebooks.
Saving a Graph
Use the pipeline's draw() method passing the path where you want to save the diagram and the diagram format. Possible formats are: mermaid-text and mermaid-image (default).
my_pipeline.draw(path=local_path)Visualizing SuperComponents
To show the internal structure of SuperComponents in your digram instead of a black box component, set the super_component_expansion parameter to True:
my_pipeline.show(super_component_expansion=True)

# or

my_pipeline.draw(path=local_path,
                 super_component_expansion=True)
Visualizing Locally
If you don't have an internet connection or don't want to send your pipeline data to the remote https://mermaid.ink, you can install a local mermaid.ink server and use it to render your pipeline.
Let's run a local mermaid.ink server using their official Docker images from https://github.com/jihchi/mermaid.ink/pkgs/container/mermaid.ink.
In this case, let's install one for a system running a MacOS M3 chip and expose it on port 3000:
docker run --platform linux/amd64 --publish 3000:3000 --cap-add=SYS_ADMIN ghcr.io/jihchi/mermaid.inkCheck that the local mermaid.ink server is running by going to http://localhost:3000/.
You should see a local server running, and now you can simply render the image using your local mermaid.ink server by specifying the URL when calling theshow()or draw() method:
my_pipeline.show(server_url="http://localhost:3000")
# or
my_pipeline.draw("my_pipeline.png", server_url="http://localhost:3000")
Example
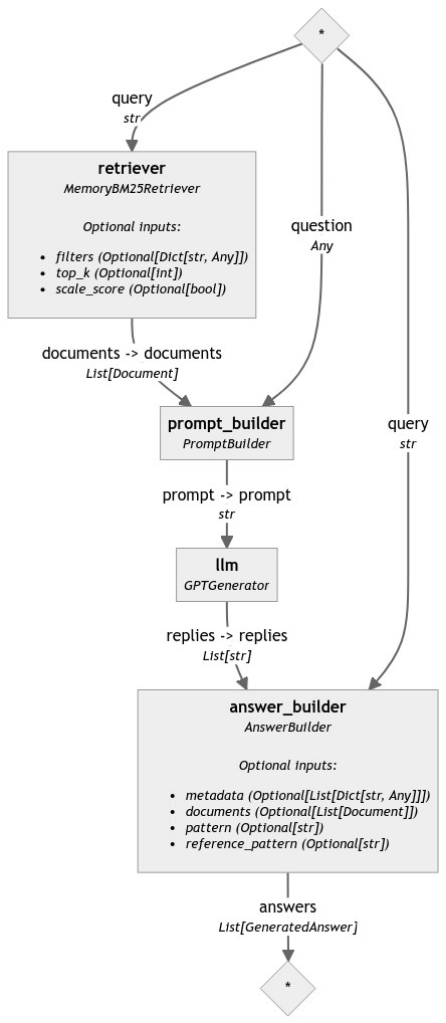
This is an example of what a pipeline graph may look like:
Importing a Pipeline to deepset Studio
You can import your Haystack pipeline into deepset Studio and continue visually building your pipeline
To do that, follow the steps described in our deepset AI Platform documentation.
Updated 7 days ago