Logging
Logging is crucial for monitoring and debugging LLM applications during development as well as in production. Haystack provides different logging solutions out of the box to get you started quickly, depending on your use case.
Standard Library Logging (default)
Haystack logs through Python’s standard library. This gives you full flexibility and customizability to adjust the log format according to your needs.
Changing the Log Level
By default, Haystack's logging level is set to WARNING. To display more information, you can change it to INFO. This way, not only warnings but also information messages are displayed in the console output.
To change the logging level to INFO, run:
import logging

logging.basicConfig(
    format="%(levelname)s - %(name)s -  %(message)s",
    level=logging.WARNING,
)
logging.getLogger("haystack").setLevel(logging.INFO)
Further Configuration
See Python’s documentation on logging for more advanced configuration.
Real-Time Pipeline Logging
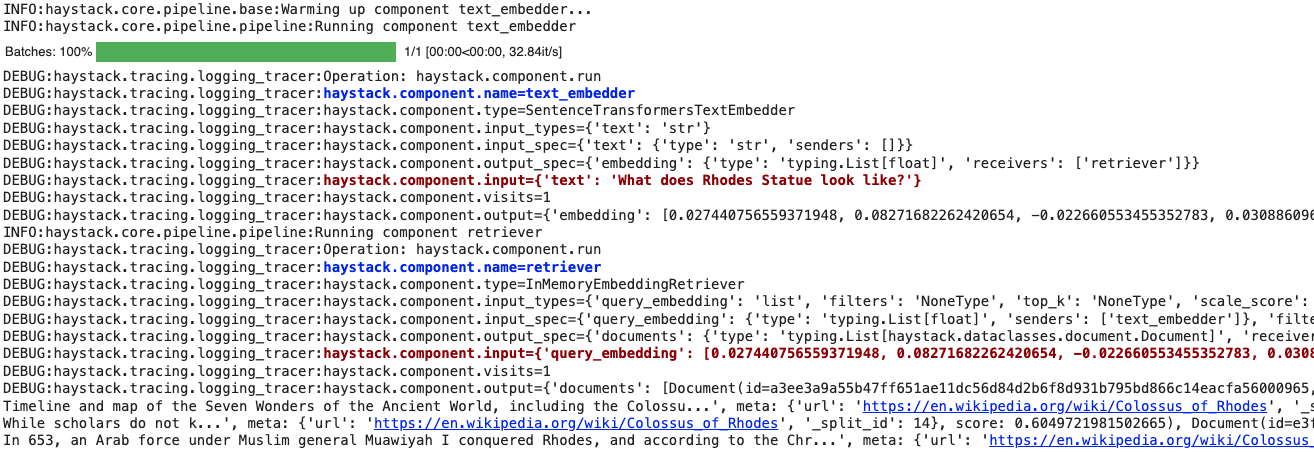
Use Haystack's LoggingTracer logs to inspect the data that's flowing through your pipeline in real-time.
This feature is particularly helpful during experimentation and prototyping, as you don’t need to set up any tracing backend beforehand.
Here’s how you can enable this tracer. In this example, we are adding color tags (this is optional) to highlight the components' names and inputs:
import logging
from haystack import tracing
from haystack.tracing.logging_tracer import LoggingTracer

logging.basicConfig(
    format="%(levelname)s - %(name)s -  %(message)s",
    level=logging.WARNING,
)
logging.getLogger("haystack").setLevel(logging.DEBUG)

tracing.tracer.is_content_tracing_enabled = (
    True  # to enable tracing/logging content (inputs/outputs)
)
tracing.enable_tracing(
    LoggingTracer(
        tags_color_strings={
            "haystack.component.input": "\x1b[1;31m",
            "haystack.component.name": "\x1b[1;34m",
        },
    ),
)
Here’s what the resulting log would look like when a pipeline is run:

Structured Logging
Haystack leverages the structlog library to provide structured key-value logs. This provides additional metadata with each log message and is especially useful if you archive your logs with tools like ELK, Grafana, or Datadog.
If Haystack detects a structlog installation on your system, it will automatically switch to structlog for logging.
Console Rendering
To make development a more pleasurable experience, Haystack uses structlog’s ConsoleRender by default to render structured logs as a nicely aligned and colorful output:

Install rich to beautify your logs even more!
JSON Rendering
We recommend JSON logging when deploying Haystack to production. Haystack will automatically switch to JSON format if it detects no interactive terminal session. If you want to enforce JSON logging:
-
Run Haystack with the environment variable
HAYSTACK_LOGGING_USE_JSONset totrue. -
Or, use Python to tell Haystack to log as JSON:
pythonimport haystack.logginghaystack.logging.configure_logging(use_json=True)

Disabling Structured Logging
To disable structured logging despite an existing installation of structlog, set the environment variable HAYSTACK_LOGGING_IGNORE_STRUCTLOG_ENV_VAR to true when running Haystack.