Debugging Pipelines
Learn how to debug and troubleshoot your Haystack pipelines.
There are several options available to you to debug your pipelines:
- Inspect your components' outputs
- Adjust logging
- Set up tracing
- Try one of the monitoring tool integrations
Inspecting Component Outputs
To view outputs from specific pipeline components, add the include_outputs_from parameter when executing your pipeline. Place it after the input dictionary and set it to the name of the component whose output you want included in the result.
For example, here’s how you can print the output of PromptBuilder in this pipeline:
from haystack import Pipeline, Document
from haystack.utils import Secret
from haystack.components.generators.chat import OpenAIChatGenerator
from haystack.components.builders.chat_prompt_builder import ChatPromptBuilder
from haystack.dataclasses import ChatMessage

# Documents
documents = [
    Document(content="Joe lives in Berlin"),
    Document(content="Joe is a software engineer"),
]

# Define prompt template
prompt_template = [
    ChatMessage.from_system("You are a helpful assistant."),
    ChatMessage.from_user(
        "Given these documents, answer the question.\nDocuments:\n"
        "{% for doc in documents %}{{ doc.content }}{% endfor %}\n"
        "Question: {{query}}\nAnswer:",
    ),
]

# Define pipeline
p = Pipeline()
p.add_component(
    instance=ChatPromptBuilder(
        template=prompt_template,
        required_variables={"query", "documents"},
    ),
    name="prompt_builder",
)
p.add_component(
    instance=OpenAIChatGenerator(api_key=Secret.from_env_var("OPENAI_API_KEY")),
    name="llm",
)
p.connect("prompt_builder", "llm.messages")

# Define question
question = "Where does Joe live?"

# Execute pipeline
result = p.run(
    {"prompt_builder": {"documents": documents, "query": question}},
    include_outputs_from="prompt_builder",
)

# Print result
print(result)
Logging
Adjust the logging format according to your debugging needs. See our Logging documentation for details.
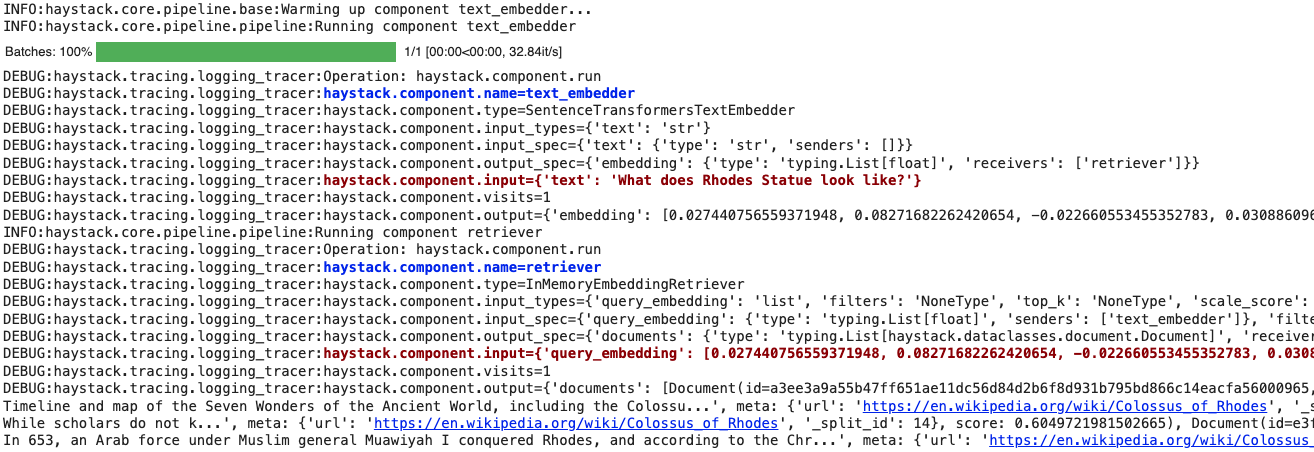
Real-Time Pipeline Logging
Use Haystack's LoggingTracer logs to inspect the data that's flowing through your pipeline in real-time.
This feature is particularly helpful during experimentation and prototyping, as you don’t need to set up any tracing backend beforehand.
Here’s how you can enable this tracer. In this example, we are adding color tags (this is optional) to highlight the components' names and inputs:
import logging
from haystack import tracing
from haystack.tracing.logging_tracer import LoggingTracer

logging.basicConfig(
    format="%(levelname)s - %(name)s -  %(message)s",
    level=logging.WARNING,
)
logging.getLogger("haystack").setLevel(logging.DEBUG)

tracing.tracer.is_content_tracing_enabled = (
    True  # to enable tracing/logging content (inputs/outputs)
)
tracing.enable_tracing(
    LoggingTracer(
        tags_color_strings={
            "haystack.component.input": "\x1b[1;31m",
            "haystack.component.name": "\x1b[1;34m",
        },
    ),
)
Here’s what the resulting log would look like when a pipeline is run:
Tracing
To get a bigger picture of the pipeline’s performance, try tracing it with Langfuse.
Our Tracing page has more about other tracing solutions for Haystack.
Monitoring Tools
Take a look at available tracing and monitoring integrations for Haystack pipelines, such as Arize AI or Arize Phoenix.