OpenTelemetry
Learn how to trace your Haystack pipelines with OpenTelemetry.
| Tracer class | OpenTelemetryTracer |
| How to enable | Configure an OpenTelemetry TracerProvider, then enable the tracer with tracing.enable_tracing(OpenTelemetryTracer(trace.get_tracer("my_application"))), or add the OpenTelemetryConnector component to your pipeline |
| Content tracing | Set HAYSTACK_CONTENT_TRACING_ENABLED to true to trace component inputs and outputs |
| Package | opentelemetry-haystack |
| API reference | opentelemetry |
| GitHub link | https://github.com/deepset-ai/haystack-core-integrations/tree/main/integrations/opentelemetry |
Overview
OpenTelemetry is an open-source observability framework for collecting traces, metrics, and logs. Haystack integrates with OpenTelemetry, so you can send traces of your pipeline runs to any OpenTelemetry-compatible backend.
OpenTelemetryTracer lives in the opentelemetry-haystack package and is not part of Haystack core. Since Haystack 3.0, OpenTelemetry tracing is no longer auto-enabled when opentelemetry-sdk is installed. Install the integration and either enable the OpenTelemetryTracer directly or add the OpenTelemetryConnector component to your pipeline.
Installation
Install the opentelemetry-haystack package:
To add traces to even deeper levels of your pipelines, we recommend you check out OpenTelemetry integrations, such as:
urllib3instrumentation for tracing HTTP requests in your pipeline,- OpenAI instrumentation for tracing OpenAI requests.
Prerequisites
A configured OpenTelemetry TracerProvider with an exporter, for example an OTLP exporter that sends traces to a collector or a backend. Set up the provider before enabling the tracer.
Usage
Enable the OpenTelemetryTracer directly to trace any Haystack pipeline, without adding a component to it. Configure your TracerProvider and set the HAYSTACK_CONTENT_TRACING_ENABLED environment variable before importing any Haystack components.
import os

os.environ["HAYSTACK_CONTENT_TRACING_ENABLED"] = "true"

from opentelemetry import trace
from opentelemetry.exporter.otlp.proto.http.trace_exporter import OTLPSpanExporter
from opentelemetry.sdk.resources import Resource
from opentelemetry.sdk.trace import TracerProvider
from opentelemetry.sdk.trace.export import BatchSpanProcessor
from opentelemetry.semconv.resource import ResourceAttributes

# Configure the OpenTelemetry SDK. A service name is required for most backends.
resource = Resource(attributes={ResourceAttributes.SERVICE_NAME: "haystack"})
tracer_provider = TracerProvider(resource=resource)
tracer_provider.add_span_processor(
    BatchSpanProcessor(OTLPSpanExporter(endpoint="http://localhost:4318/v1/traces")),
)
trace.set_tracer_provider(tracer_provider)

from haystack import tracing
from haystack_integrations.tracing.opentelemetry import OpenTelemetryTracer

# Enable the OpenTelemetry tracer
tracing.enable_tracing(OpenTelemetryTracer(trace.get_tracer("my_application")))
Each pipeline run then produces a trace that includes the entire execution context, including prompts, completions, and metadata. You can view the traces in your OpenTelemetry-compatible backend.
Alternative: the OpenTelemetryConnector component
If you prefer to manage tracing as part of your pipeline definition, you can add the OpenTelemetryConnector component instead. It enables the same OpenTelemetry tracing as soon as it is initialized.
See the OpenTelemetryConnector documentation page for full usage examples, or check out the integration page.
Visualizing Traces During Development
Use Jaeger as a lightweight tracing backend for local pipeline development. This allows you to experiment with tracing without the need for a complex tracing backend.
-
Run the Jaeger container. This creates a tracing backend as well as a UI to visualize the traces:
shelldocker run --rm -d --name jaeger \-e COLLECTOR_ZIPKIN_HOST_PORT=:9411 \-p 6831:6831/udp \-p 6832:6832/udp \-p 5778:5778 \-p 16686:16686 \-p 4317:4317 \-p 4318:4318 \-p 14250:14250 \-p 14268:14268 \-p 14269:14269 \-p 9411:9411 \jaegertracing/all-in-one:latest -
Install the integration and the OTLP exporter:
-
Configure
OpenTelemetryto use the Jaeger backend and enable the tracer:pythonfrom opentelemetry import tracefrom opentelemetry.exporter.otlp.proto.http.trace_exporter import OTLPSpanExporterfrom opentelemetry.sdk.resources import Resourcefrom opentelemetry.sdk.trace import TracerProviderfrom opentelemetry.sdk.trace.export import BatchSpanProcessorfrom opentelemetry.semconv.resource import ResourceAttributesfrom haystack import tracingfrom haystack_integrations.tracing.opentelemetry import OpenTelemetryTracer# Service name is required for most backendsresource = Resource(attributes={ResourceAttributes.SERVICE_NAME: "haystack"})tracer_provider = TracerProvider(resource=resource)processor = BatchSpanProcessor(OTLPSpanExporter(endpoint="http://localhost:4318/v1/traces"))tracer_provider.add_span_processor(processor)trace.set_tracer_provider(tracer_provider)tracing.enable_tracing(OpenTelemetryTracer(trace.get_tracer("my_application"))) -
Run your pipeline:
python...pipeline.run(...)... -
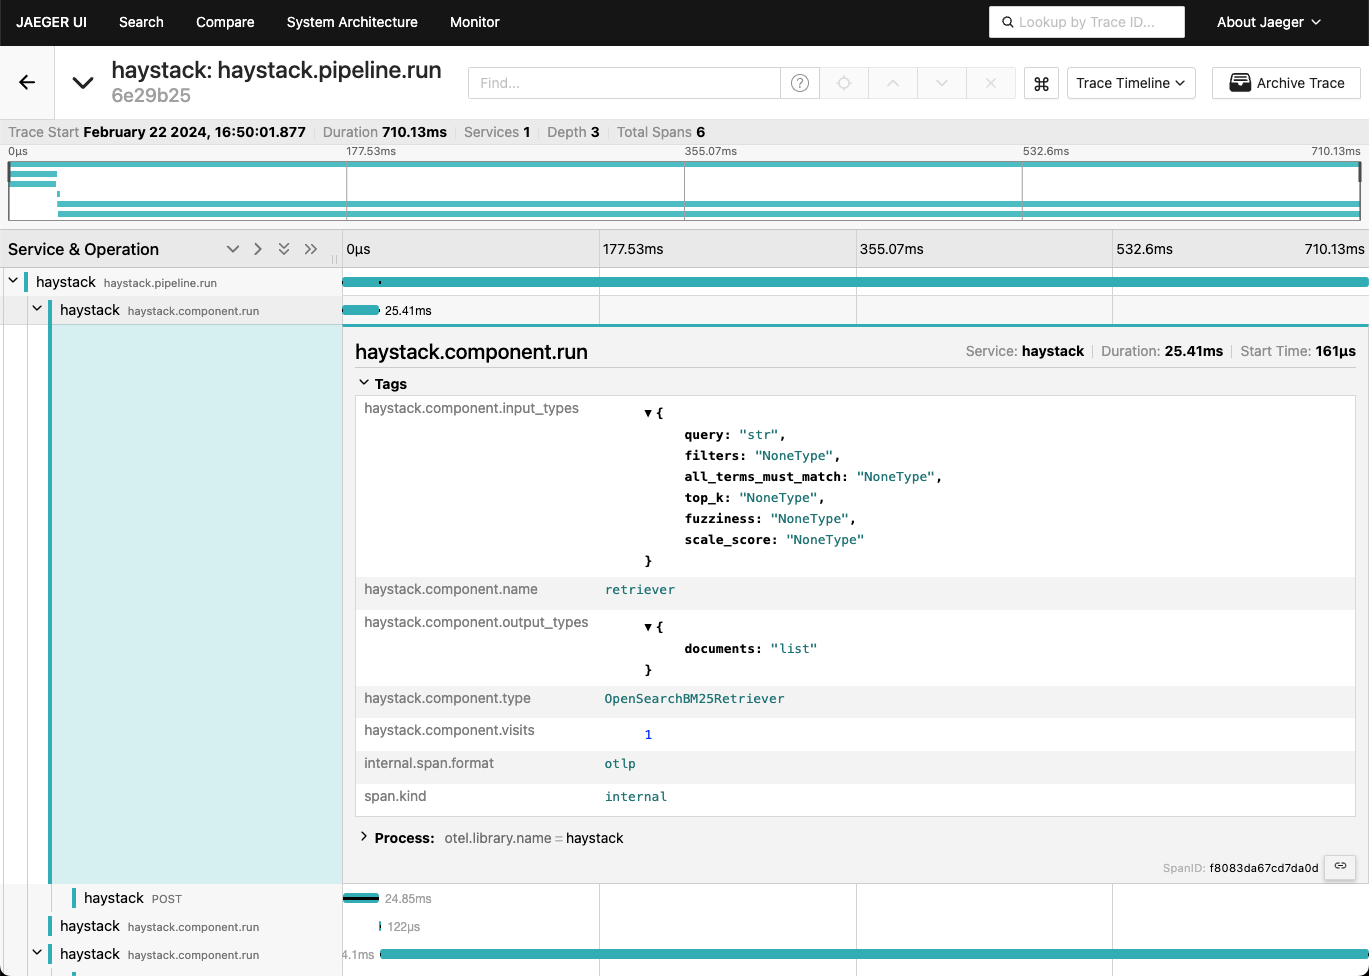
Inspect the traces in the UI provided by Jaeger at http://localhost:16686.